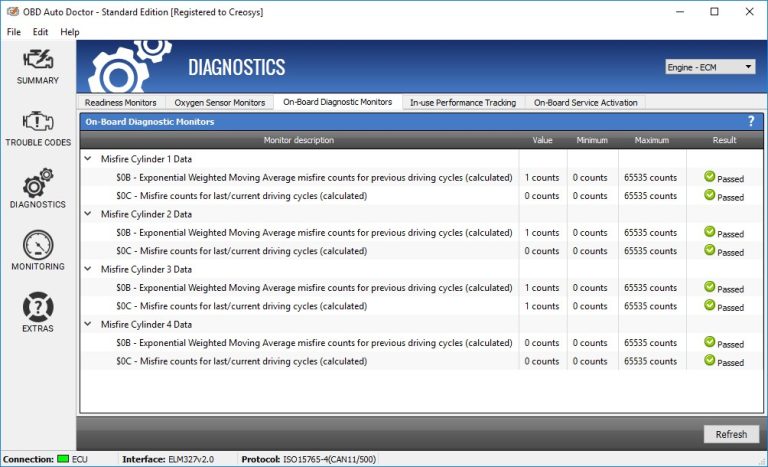
What Does Engine Load Mean on OBD2 Live Data? a Clear Answer
Engine load on OBD2 live data is a calculated percentage that shows how hard the engine is working at the current RPM. A healthy car reads low at idle, moderate at cruise, and near full at wide-open throttle.
If you’ve ever asked what does engine load mean on OBD2 live data, the short answer is that it’s a calculated percentage showing how hard the engine is working compared with its maximum possible airflow at that exact RPM. Unlike a stored trouble code, this live value changes constantly as you drive, and it can reveal problems that a code alone won’t show. This guide explains how load is calculated, what normal readings look like, and when a high or low number means you should dig deeper.
- What it is: A calculated percentage of airflow compared with the engine’s peak airflow at the same.
- Normal ranges: Roughly 15-30% at idle, 30-60% at cruise, and 80-100% under full throttle on most.
- Not throttle position: Load reflects real air being consumed, so a mismatch can reveal vacuum leaks, MAF.
- Scanner needs: Any OBD2 scanner with live data can read it, but the engine must be.
- Best practice: Log load with RPM and fuel trims while the car is healthy, then compare.
What Does Engine Load Mean on OBD2 Live Data? A Clear Answer
Engine Load Is a Percentage, Not a Horsepower Number
Engine load appears on most OBD2 scanners as “Calculated Load Value” or “LOAD_PCT” and is shown as a percentage. It is not a horsepower figure, and it is not torque. It is a snapshot of how much air the engine is pulling in right now compared with the most air it could pull in at the same RPM with the throttle wide open.
A reading of 30 percent means the engine is using roughly a third of its available air capacity at that moment. A reading near 100 percent means the driver is demanding just about everything the engine can give.
Why the ECU Tracks Load at All
The engine control unit, or ECU, needs to know load to make fuel, ignition, and emissions decisions. When load is low, the ECU leans out the mixture and advances timing. When load climbs, it enriches the fuel mixture and adjusts spark timing to protect the engine and keep emissions in check.
That makes engine load one of the most useful live data PIDs for a DIY owner. It tells you whether the engine is genuinely struggling, loafing along, or being asked to work hard.
How the ECU Calculates Engine Load (and Why It’s Not Throttle Position)
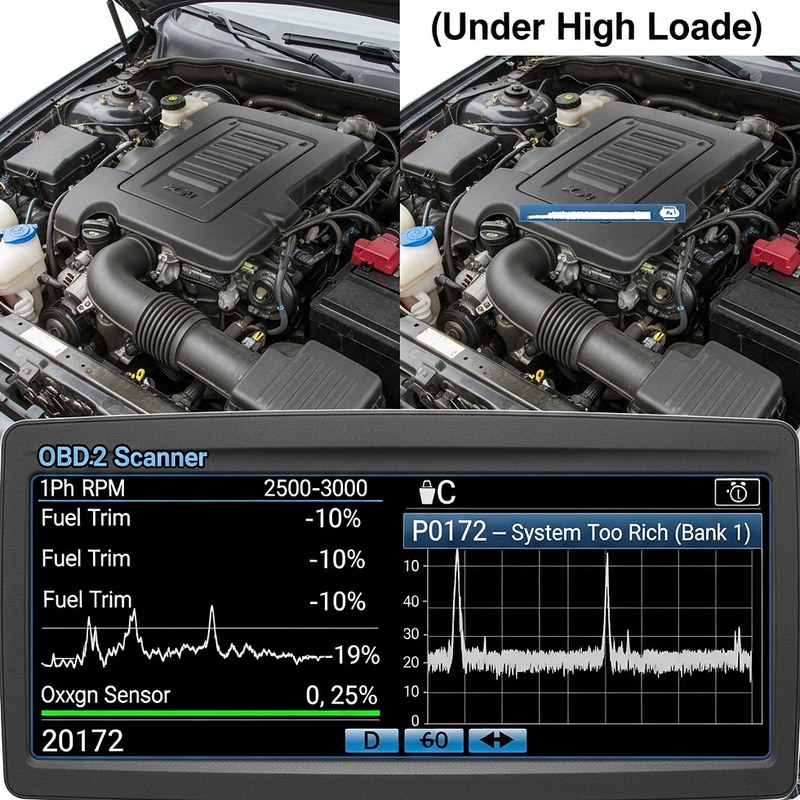
Calculated Load vs. Actual Torque Demand
The standard formula used by OBD2 systems comes from the SAE J1979 protocol. It compares current intake airflow with the theoretical peak airflow at the same RPM at sea level, then multiplies by 100 to get a percentage. The result is called calculated load, and it is a generic PID that nearly every OBD2 scanner can display.
Some modern vehicles also report “absolute load,” which compares current airflow to maximum airflow at a fixed reference point. On turbocharged engines, calculated load can climb above 100 percent during heavy boost, and that is normal for that setup.
Why Throttle Position and Engine Load Disagree
Throttle position tells you how far the pedal or butterfly valve is open. Engine load tells you how much air is actually moving through the engine. The two can disagree for many reasons.
For example, a car with a dirty throttle body can show high throttle position but low load because the engine cannot draw in enough air. A car with a vacuum leak can show high load at idle because unmetered air is sneaking past the seal. When you compare throttle position and engine load side by side, mismatches become clues.
What Is a Normal Engine Load Reading on a Healthy Car?
Typical Readings at Idle, Cruise, and Wide-Open Throttle
There is no single “correct” number because load changes with temperature, elevation, gear, and accessories. But most healthy gasoline cars follow a familiar pattern.
At warm idle, many vehicles sit between 15 and 30 percent. At steady highway cruise, readings usually land between 30 and 60 percent, depending on speed, wind, and grade. During wide-open throttle acceleration, load should climb toward 80 to 100 percent. Turbocharged cars may exceed 100 percent under boost.
How Engine Type Changes the Numbers
Diesel engines, turbocharged gasoline engines, and large V8s can all show different baselines. A small turbo four-cylinder may show higher calculated load at cruise than a big naturally aspirated V8 doing the same work. Elevation also matters, because thinner air changes airflow calculations.
What High or Low Engine Load Readings Tell You
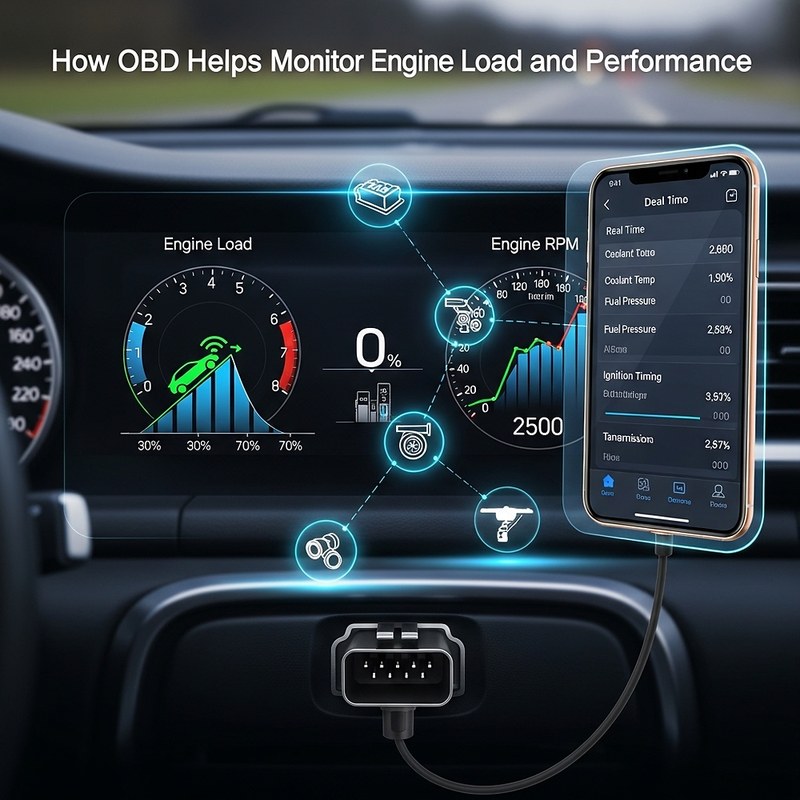
High Load at Idle or Cruise: Causes and Related Trouble Codes
If engine load stays high when the car is coasting or idling, the engine is doing extra work. Common causes include vacuum leaks, a faulty MAF sensor, a dragging brake caliper, a failing torque converter, or a partially clogged catalytic converter.
These conditions often appear alongside codes such as P0171 or P0174 (system too lean), P0300 (random misfire), or MAF-related codes in the P0100 family. The load reading helps you decide which codes deserve attention first.
Low Load Under Acceleration: Causes and Related Trouble Codes
A car that feels slow but shows low engine load at wide-open throttle is not getting the air or fuel it needs. Possible causes include a clogged fuel filter, weak fuel pump, dirty air filter, boost leak on a turbo car, or ignition misfires that prevent clean combustion.
Watch for misfire codes in the P0300 range, fuel pressure codes, or fuel trim codes. Low load plus low power often points to fuel delivery or air delivery, not a mechanical failure inside the engine.
When High Load Is Normal and Not a Fault
High load is not always a warning. Climbing a long grade, passing another car, towing a trailer, or running the defroster on a cold morning all increase load. A short spike during acceleration is normal. A load reading that stays pinned near 100 percent during normal flat-road cruise is not.
OBD2 Scanner Compatibility, Port Location, and Live-Data Limits
Model-Year and Protocol Coverage: What Your Scanner Must Support
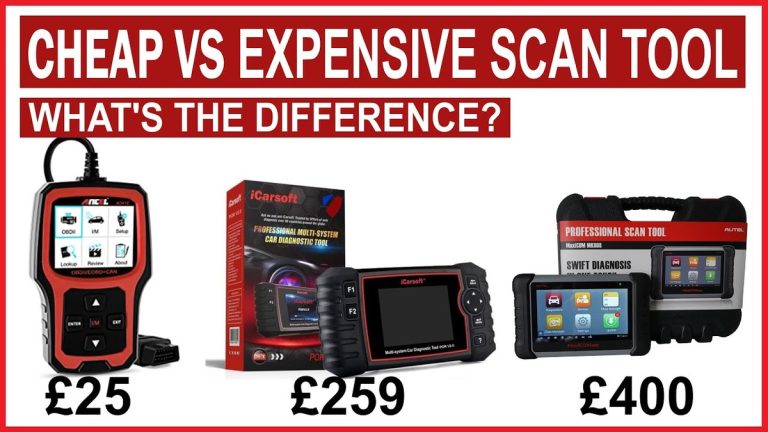
Engine load is a generic OBD2 PID, which means any scanner that reads live data on a 1996 or newer US-market vehicle should display it. You do not need a professional-grade tool just to see load. However, the refresh rate, the number of PIDs shown at once, and the graphing quality vary widely between budget and professional scanners.
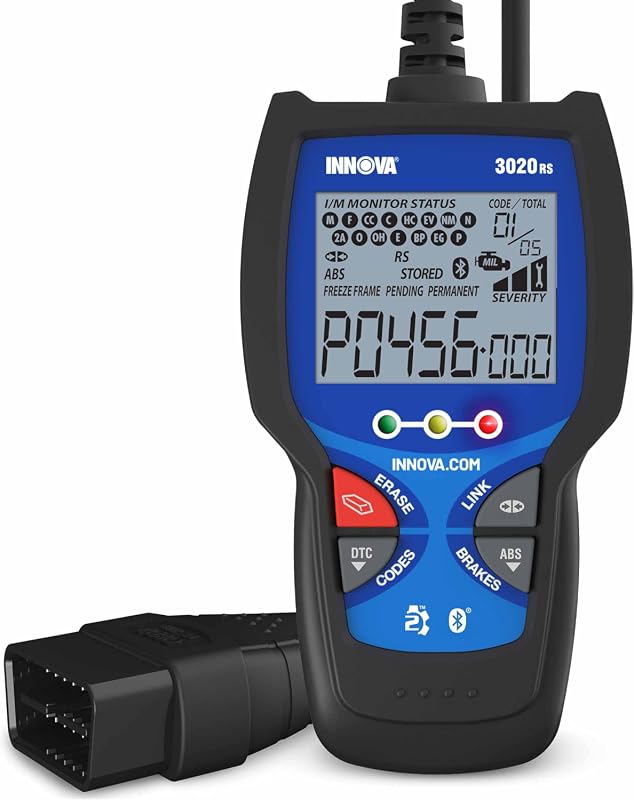
If you are shopping for a scanner, check that it supports live data streaming and not just code reading. Some very basic code readers cannot display live PIDs at all. Our guide on how to find live data on an OBD2 scanner walks through the menu steps for common scanner styles.
Check: Confirm your vehicle is OBD2 compliant (1996 or newer in the US), verify the scanner supports live data, and confirm the app or display shows generic PIDs such as Calculated Load Value. Limitations: Hybrid and electric vehicles may hide or rename engine load PIDs, and some manufacturer-specific enhanced PIDs require a higher-tier scanner.
Where the Port Is and Which Ignition Mode to Use
The OBD2 port is almost always under the driver’s side dash, near the steering column or hood release. If you cannot find it, the vehicle owner’s manual will show the exact location.
Engine load requires the engine to be running. Turning the key to the “on” position without starting the engine will not produce a meaningful load value, because no combustion is happening. For a complete walkthrough of the right ignition modes, read our article on whether you need the engine running to use an OBD2 scanner.
Live-Data Limits, Emissions Readiness, and Reset Limitations
Live data is a snapshot, not a recording. Most budget scanners update a few times per second, which is fine for steady cruise readings but can miss brief spikes. If you need to catch an intermittent problem, look for a scanner with data logging or recording features.
Clearing codes will also clear the emissions readiness monitors that your state may check during an inspection. Our explanation of Mode 6 data on an OBD2 scanner shows how to check monitor results without erasing useful information.
App Permissions, Firmware, and Bluetooth Adapter Caveats
Bluetooth OBD2 adapters rely on a smartphone app, and the app may request location, storage, or account permissions. Before granting access, consider whether the developer needs that data and how it might be shared. Some apps also store VINs and live data in the cloud.
Firmware updates matter, too. An outdated adapter or app can misread PIDs or drop the connection while driving. If your adapter keeps dropping out, our guide on why OBD2 scanners keep disconnecting covers the usual causes and fixes.
Using Engine Load for Maintenance and Diagnostics
Combining Engine Load with Fuel Trims and RPM
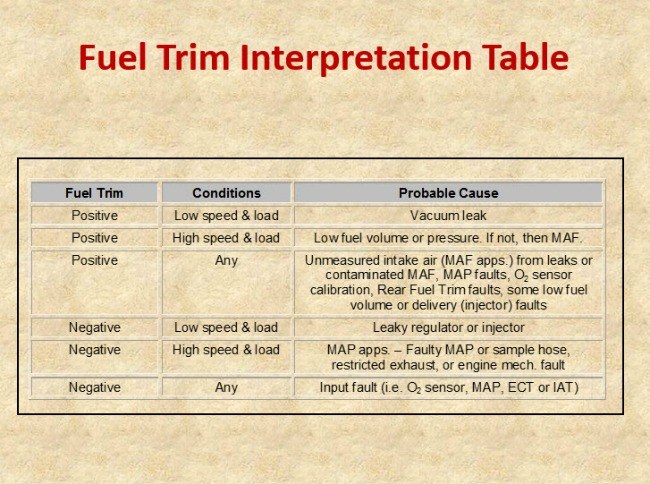
Engine load is most useful when you read it alongside fuel trims and RPM. If load is high at idle and short-term fuel trim is climbing, a vacuum leak or MAF problem becomes more likely. If load stays low during a misfire, the engine is not burning the air and fuel it receives.
This combination is also helpful for spotting transmission issues. If RPM climbs but load stays flat, the engine is not feeling the load it should, which can point to torque converter or transmission slip.
When to Stop Diagnosing and Call a Professional
Engine load is a clue, not a verdict. If the readings point to a problem but the cause is not obvious after checking the basics, stop guessing. Replacing parts blindly costs money and can create new faults.
A professional with a scan tool and service information can perform controlled tests, compare live data against factory specifications, and check things like fuel pressure and exhaust backpressure. If the check engine light is flashing, the safest move is to avoid driving and call for help.
Engine Load vs. Related OBD2 PIDs: A Side-by-Side Comparison
MAF, MAP, TPS, and RPM: What Each PID Adds
Engine load works well with other live data PIDs. The MAF sensor measures actual air mass entering the engine, MAP measures intake manifold pressure, TPS measures throttle plate angle, and RPM shows engine speed. Each one answers a different question.
| PID | Best for | Owner consideration | Driver consideration |
|---|---|---|---|
| Engine Load | Overall effort and demand | Generic on all OBD2 cars; easy to log | Needs engine running; changes fast |
| MAF | Measuring actual air mass | Useful for diagnosing vacuum leaks and dirty sensors | Sensor is engine bay item; not driver-controlled |
| MAP | Intake manifold pressure | Key for turbo and older GM-style cars | Boost spikes can appear quickly |
| TPS | Throttle plate angle | Cheap sensor; common failure point | Pedal feel may not match sensor output |
| RPM | Engine speed | Universal on every scanner | Used with load to spot transmission slip |
Which PID Fits Which Driver and Vehicle
A commuter with a late-model sedan can usually diagnose most issues using engine load, RPM, and fuel trims. A performance driver with a turbocharged car should watch MAP and load together to catch boost leaks. A diesel owner may rely more on load and fuel pressure, since diesel engines do not use a throttle plate the same way gasoline engines do.
Start with engine load, then add PIDs that answer the specific question you are investigating. That keeps the screen readable and the diagnosis focused.
The Bottom Line on Engine Load and Your Next Steps
What Monitoring Engine Load Costs You
Engine load is a free PID on any OBD2 scanner that supports live data. The cost is the scanner itself, not the reading. Budget code readers with live data are affordable, while professional-grade scanners with fast refresh rates and data logging cost more. Subscription-based apps may charge for advanced features, but basic load readings are usually included.
Your Next Move: Log, Compare, or Visit a Pro
Start by recording a clean baseline. On a warm, level road, note load at idle, at a steady 55 mph cruise, and during one full-throttle pull in a safe location. Keep that log in your phone or a notebook.
If the check engine light comes on later, compare the new readings with that baseline. Small changes may just reflect weather or traffic. Large swings, especially when paired with trouble codes, are a reason to investigate further or call a professional.
- Best for: Any owner with an OBD2 scanner who wants a quick, meaningful read on engine health without guessing.
- Think twice if: You expect engine load alone to name the exact failed part; it is a diagnostic clue, not a replacement for proper testing.
- Next step: Save a baseline log of load, RPM, and fuel trims while your car is running well, and compare against it when a code appears.
Frequently Asked Questions
No. Throttle position shows how far the throttle plate is open, while engine load shows how much air the engine is actually consuming. They can disagree when there is a vacuum leak, a dirty MAF sensor, or a fuel delivery problem.
Most healthy gasoline cars show roughly 15 to 30 percent at warm idle. The exact number depends on engine size, accessories like air conditioning, elevation, and whether the engine is turbocharged.
Yes. Engine load is a live calculation based on airflow during combustion, so the key must be in the run position with the engine started. Key-on, engine-off mode will not show a meaningful load value.
Most budget scanners with a live data or data stream menu can display engine load, since it is a generic OBD2 PID. Very basic code-only readers cannot. Check the product description for live data support before buying.
No. Clearing codes erases valuable diagnostic information and resets emissions readiness monitors. Record the load, fuel trims, and any freeze frame data first, then diagnose the cause instead of erasing the evidence.
It depends on the cause. A short high-load spike during acceleration is normal, but sustained high load at idle or cruise can indicate a vacuum leak, dragging brake, or failing torque converter. If the check engine light flashes, stop driving and get professional help.