How to Find Live Data on an OBD2 Scanner Without Guesswork
Live data shows real-time sensor values from your engine, not just stored trouble codes. With the right scanner and menu, you can watch RPM, coolant temp, fuel trim,and O2 sensor voltage to pinpoint issues faster.
Learning how to find live data on an OBD2 scanner can turn a flashing check-engine light into a clear repair plan. A trouble code tells you which system failed. Live data tells you why it failed. Instead of replacing parts blindly, you can watch sensor readings in real time. This guide covers what live data is, how to display it,and how to read the values that matter.
- Live data vs. codes: Codes say which system failed; live data shows why it happened.
- Check compatibility first: Confirm your scanner supports your vehicle’s model-yearand protocol before you rely on it.
- Set the right ignition mode: Most scanners need the key on, engine off, to connect; some live data requires.
- Know normal ranges: Watch coolant temp, RPM, fuel trim,and O2 sensor response to spot problems early.
- Protect your dataand battery: Save freeze-frame readings before clearing codes,and never connect to a damaged battery.
What Is Live Data on an OBD2 Scanner?(And Why It Beats Guesswork)
Live data is a real-time stream of sensor values from your vehicle’s engine control module(ECM,. When you plug in a scan tool, it asks the ECM for specific data points called PIDs(Parameter Identification,. The scanner displays them as numbers, gauges, or graphs that update continuously.
This matters because a code alone can point you in the wrong direction. For example, a lean fuel code could come from a vacuum leak, a weak fuel pump, a dirty mass airflow sensor, or a faulty oxygen sensor. Live data helps you narrow that list by watching how the sensors actually respond.
Live Data vs. Diagnostic Trouble Codes: The Core Difference
Diagnostic trouble codes(DTCs) are stored fault codes. When the ECM detects a problem, it logs a code like P0301(cylinder 1 misfire,. That code remains in memory even if the problem goes away. A pending code may appear before a full code sets, giving you an early warning.
Live data is different. It shows current values only. You can watch coolant temperature climb, see fuel trim correct a vacuum leak, or watch an O2 sensor switch from lean to rich. Codes tell you what happened. Live data tells you what is happening right now.
Which PIDs Actually Appear in a Typical Live Data Feed
Common PIDs include engine RPM, vehicle speed, coolant temperature, intake air temperature, throttle position, fuel trim(short-term and long-term,, oxygen sensor voltage, battery voltage,and calculated load. Some vehicles also report transmission temperature, fuel pressure,and turbo boost, depending on make and model.
A generic OBD2 scanner may only show the standard 10-20 PIDs defined by the OBD2 regulations. Manufacturer-specific PIDs, like cylinder timing or diesel particulate filter status, often require a brand-level or professional scanner. If a value you want isn’t listed, your scanner may not support that PID for your vehicle.
Before You Scan: Port Location, Ignition Mode,and Vehicle Compatibility
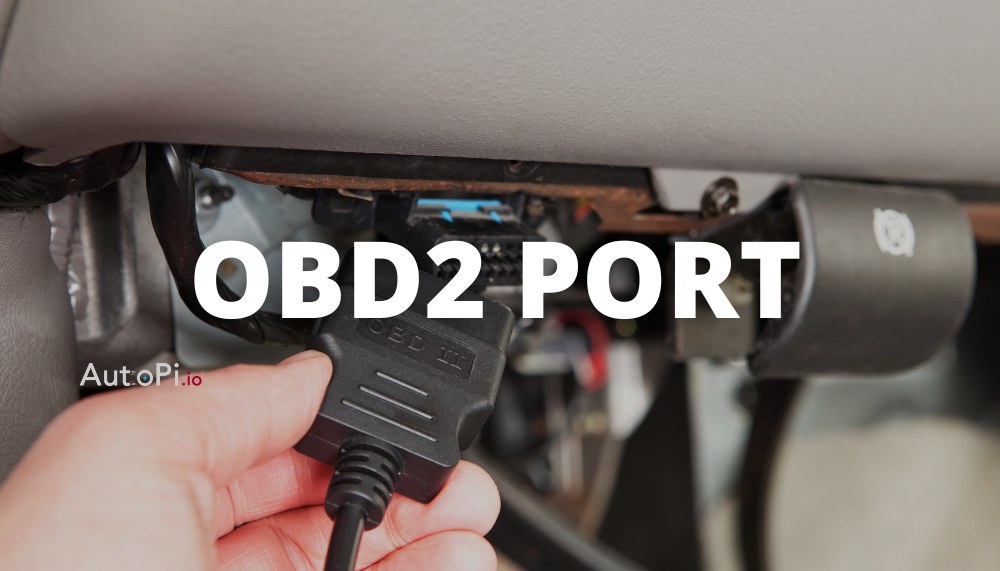
Getting live data on screen starts before you touch the scanner. You need the right port, the right key position,and a scanner that speaks your vehicle’s language.
Check: Verify your vehicle’s model-year, protocol support,and whether the scanner covers your make and model. Limitations: Some scanners handle only gasoline engines, while others add diesel or hybrid coverage. Confirm before you buy or rely on it.
Locating the OBD2 Port and Setting the Correct Ignition Mode
The OBD2 port is usually under the driver’s side dashboard, within reach of the steering column. It may be behind a small plastic cover, near the fuse panel, or above the pedals. If you can’t find it, check the owner’s manual or look for a 16-pin trapezoid connector.
For most scanners, turn the key to the “ON” or “RUN” position without cranking the engine. That powers the ECU and the scanner. Some live data, like RPM or fuel trim, requires the engine to be running. Check your scanner’s instructions for the correct mode,and never crank the engine while a scan tool is connected unless the manual says it’s safe.
Model-Year and Protocol Coverage: OBD1 vs. OBD2 and CAN Bus
OBD2 became standard on most gasoline vehicles sold in the US for model-year 1996 and newer. Earlier vehicles use OBD1 or manufacturer-specific systems that require adapters or older scan tools. Even among OBD2 vehicles, the communication protocol varies.
Since about 2008, most vehicles use CAN(Controller Area Network, which is faster and supports more data. Older vehicles may use other protocols like ISO 9141 or J1850. If your scanner doesn’t support the protocol, it may connect but show no live data. If you’re stuck, check our guide on why an OBD2 scanner won’t connect.
Step-by-Step: How to Display Live Data on Your OBD2 Scanner
Once you’ve confirmed compatibility, follow these general steps. The exact menu names vary by scanner brand, but the flow is similar.
- Plug the scanner into the OBD2 port with the ignition off.
- Turn the key to the ON position(engine off) or start the engine, depending on your scanner’s instructions.
- Wait for the scanner to power up and establish communication with the ECU.
- Select”Live Data,” “Data Stream,” or “Sensor Data” from the main menu.
- Choose which PIDs to display, or select”All” to see everything available.
- Watch the values update. Use the graph or gauge view if your scanner has one.
Pairing the Scanner and Granting App Permissions Safely
Bluetooth and Wi-Fi scanners require a phone app. On Android, Bluetooth discovery often needs location permission, even though the app isn’t tracking you. On iPhone, Bluetooth permission is separate. Grant only the permissions the app actually needs,and review them periodically.
Navigating the Live Data Menu and Using Freeze-Frame Data
Freeze-frame data is a snapshot of engine conditions at the exact moment a trouble code was set. It includes values like RPM, coolant temperature,and vehicle speed at the time of the fault. This is stored data, not live, but it’s extremely useful for intermittent problems that don’t reproduce easily.
On most scanners, freeze-frame appears alongside or near the stored codes. Some apps show it as a separate menu. Always check freeze-frame before clearing codes, because clearing wipes it out.
How to Read Live Data Like a Mechanic: Key PIDs and Normal Ranges

Numbers only help if you know what “normal” looks like. Here are general ranges for common PIDs. Always compare against your vehicle’s service manual or a known-good reading, because exact values vary.
Coolant Temperature, RPM,and Fuel Trim Readings
Coolant temperature should climb to operating range, typically around 190-220°F(88-105°C, once warm. If it stays low, a thermostat may be stuck open. If it climbs past normal or spikes, check for cooling system issues like a failing fan or low coolant.
Idle RPM usually sits between 600 and 900 in Park or Neutral with the engine warm. It may rise when cold, when AC is on, or when the battery is charging. Fuel trim comes as short-term(STFT)and long-term(LTFT,. STFT should hover near 0% and swing within about ±10%. LTFT should stay near 0-10%. Large positive numbers mean the engine is running lean; large negative numbers mean rich.
O2 Sensor and Catalyst Monitor Data
Upstream oxygen sensors(before the catalyst) should cycle rapidly between about 0.1V(lean)and 0.9V(rich) when in closed loop. This switching shows the sensor is alive and the fuel control is working. A lazy sensor that stays stuck at one voltage may be failing. Learn more about using an OBD2 scanner to identify a bad oxygen sensor.
Downstream sensors(after the catalyst,) should stay fairly steady, usually around 0.6-0.7V, if the catalytic converter is working. If the downstream sensor mirrors the upstream cycling, the catalyst may not be cleaning exhaust effectively. Catalyst monitor data may show “ready” or “not ready” depending on drive cycle completion.
Tire Pressure and TPMS Live Data(With Placard and Cold-Pressure Rules)
Some vehicles broadcast tire pressure values through the OBD2 data stream, but many do not. If your car has TPMS, the pressures may appear as individual wheel PIDs on certain scan tools. Other vehicles only show a warning light,and require a TPMS tool to read sensor IDs and pressures.
Always use the pressure from the vehicle placard(usually on the driver’s door jamb or inside the fuel door,, not the number molded into the tire sidewall. Check pressures when tires are cold, meaning the car hasn’t been driven for at least a few hours. Driving heats tires and raises pressure, so a hot reading can look normal when the cold pressure is low.
Live Data Limits: Emissions Readiness, Resets,and Firmware
Live data is powerful, but it has limits. Knowing them keeps you from drawing the wrong conclusion.
Emissions Readiness and State Inspection Rules
Emissions readiness monitors track whether your vehicle’s emission systems have completed their self-tests. A scanner can show each monitor as “Ready” or “Not Ready.” If you clear codes, monitors reset to “Not Ready,” and your vehicle may fail a state emissions inspection until you complete a drive cycle.
Inspection rules vary by state, so check your local requirements before assuming a “Ready” status passes. Some states allow one or two “Not Ready” monitors, while others require all monitors ready. See our guide on passing emissions after clearing codes for drive-cycle tips.
Why Clearing Codes Erases Your Live Data Trail
Clearing diagnostic trouble codes also clears freeze-frame data, resets emissions monitors,and wipes certain learned values. That means you lose the exact snapshot that could identify an intermittent fault. Always record or photograph live dataand freeze-frame readings before you clear anything.
Also, clearing codes doesn’t fix the underlying problem. If the fault is still present, the code will return, often within a few drive cycles. Some permanent codes cannot be cleared with a standard scanner at all.
Firmware Limits and When You Need a Professional-Grade Scanner
A basic scanner may only read engine codes and generic PIDs. It usually can’t access ABS, airbag(SRS,, transmission, or body control module data. Those systems need a scanner with enhanced or manufacturer-specific coverage.
Bidirectional controls, like commanding a fuel pump on or running a cylinder cutout test, require a professional-grade or OEM-level tool. Firmware updates can add vehicle coverage or fix bugs, so check whether the scanner supports updates before you rely on it. If you’re deciding between basic and advanced tools, our cheap vs. expensive OBD2 scanner comparison explains the trade-offs.
Battery and Electrical Cautions When Using Live Data
Your scan tool draws power from the OBD2 port, which comes from the vehicle’s battery. That makes battery health part of the diagnostic picture.
System Voltage, Battery Chemistry,and State of Charge vs. Health
With the engine off, system voltage should read around 12.6 volts for a fully charged lead-acid battery. With the engine running, alternator output typically raises it to about 13.5-14.5 volts. If voltage stays low with the engine running, the alternator may be weak, or there may be a charging system fault.
Voltage only tells you state of charge, not battery health. A battery can show 12.6 volts but fail to deliver enough cranking amps on a cold morning. For health, use a battery tester that applies a load, or have the battery tested professionally.
Correct Connection Orderand Damaged-Battery Stop Conditions
Plug the scanner into the OBD2 port before turning the ignition on. When you’re done, turn the ignition off before unplugging the scanner. This avoids voltage spikes that could confuse the scanner or the vehicle’s modules.
Hybridand EV High-Voltage Safety Notes
Hybridand electric vehicles use high-voltage battery packs, often well above 200 volts. The OBD2 port itself is low-voltageand safe to connect a scanner to. However, the orange cablesand high-voltage components under the hood are dangerous.
OBD2 Scanner Comparison: Bluetooth, Wi-Fi, or Standalone for Live Data?
Your choice of scanner affects how easily you can view live dataand what features you get. Each type has trade-offs.
Bluetooth vs. Wi-Fi vs. Standalone: Side-by-Side Comparison
| Option | Best for | Owner consideration | Driver consideration |
|---|---|---|---|
| Bluetooth | Budget-friendly phone-based apps | May need location permission for discovery; check app privacy policy | Small phone screen can distract; use a secure mount and pull over to read data |
| Wi-Fi | Faster data transfer with some apps; common for iOS | Phone may need to join the adapter’s Wi-Fi network, interrupting internet | Similar distraction risk; keep phone in a mount and avoid scrolling while driving |
| Standalone | No phone needed; built-in screen works anywhere | Higher upfront cost; firmware updates may be manual | Larger screen is easier to read while parked; less phone distraction |
Evaluation Criteria: Refresh Rate, App Permissions,and Warranty Support
Refresh rate determines how often the scanner updates the live data values. A faster refresh rate helps you catch quick changes, like an O2 sensor switch or a momentary misfire. Slower refresh rates may miss brief events, making intermittent problems harder to spot.
Before buying, review the app’s permissionsand privacy policy, check whether firmware updates are free,and confirm the warranty lengthand what it covers. Some apps require a paid subscription for advanced data or graphing, so factor that into the total cost.
From Live Data to Next Steps: When to DIY and When to Call a Pro
Live data gives you evidence, but it doesn’t replace a repair manual or a trained technician. Use it to make better decisions about your next step.
Recognizing When a Professional Diagnostic Is Required
If you see multiple codes, values far outside normal ranges, or problems involving safety systems like ABS, airbags, or steering, stop guessingand call a professional. Also seek help if the repair requires special tools, refrigerant handling, high-voltage service, or procedures you’re not trained to perform.
Even if you don’t do the repair yourself, live data helps you describe the problem clearly. A mechanic can use your recorded readingsas a starting point, saving diagnostic timeand money.
Turning Live Data Into a Maintenance Plan
Use live data to catch small issues before they become big ones. Watch fuel trims drift over time, coolant temperature trends,and O2 sensor response. A slow change, like LTFT creeping from 3% to 12%, can point to a developing vacuum leak or fuel issue long before the check-engine light comes on.
Keep a simple log of your readings, either written or in a notes app. Date each entryand note the conditions(engine cold or warm, city or highway,. Over time, that log becomes a maintenance recordthat helps you spot patternsand decide when a professional check makes sense.
- Best for: Home mechanicsand DIY owners who want real-time sensor data to diagnose issues without replacing parts blindly.
- Think twice if: You need advanced manufacturer-specific functions like module coding or bidirectional controls; you’ll likely need a professional-grade scanner.
- Next step: Confirm your scanner supports your vehicle’s protocol, then practice reading live data while parked before you need it on the road.
Frequently Asked Questions
Live data shows real-time sensor readings from your vehicle’s computer, like RPM, coolant temperature, fuel trim,and oxygen sensor voltage. Unlike stored trouble codes, live data updates continuously so you can watch how systems behave while idling or driving.
It depends on the scanner and vehicle. Many scanners let you view some data with the key onand engine off, but engine-dependent values like RPMand fuel trim need the engine running. Check your scanner’s manual for the recommended ignition mode.
Common causes include an unsupported protocol, a loose connection, or a scanner that only reads codesand doesn’t support live data. Try a different ignition mode or check your vehicle’s compatibility first.
Yes. Clearing codes also clears freeze-frame dataand resets emissions readiness monitors. Always record or screenshot the live dataand freeze-frame values before clearing codes so you don’t lose the diagnostic trail.
Cheap scanners can be accurate for basic PIDs like RPMand coolant temp, but they may update slowly or miss manufacturer-specific data. For advanced diagnostics like ABS or module coding, you’ll likely need a professional-grade tool.
Coolant temperature typically settles around190-220°F when warm; idle RPM usually falls between600 and900; fuel trim should stay near zero with small swings. O2 sensor voltage should cycle between about0.1V and0.9V in closed loop. Ranges vary by vehicle, so compare to a known-good reading orthe service manual.