How to Find Live Data on an OBD2 Scanner Without Guesswork
Live data shows your engine’s real-time sensor readings, so you can see patterns instead of guessing from a stored code. Use the right PIDs, compare a few readings, and record everything before you clear codes.
Knowing how to find live data on an obd2 scanner is the difference between guessing at a repair and seeing what your engine is doing in real time. Live data helps you catch early problems, confirm a repair, and avoid buying parts you do not need.
- Codes vs. live data: Codes say what failed; live data shows what is happening now. Use both together.
- Start with six PIDs: RPM, coolant temp, fuel trims, O2 voltage, MAF, and battery voltage cover most basic.
- Refresh limits: Selecting too many PIDs slows the refresh rate; keep the set small for usable.
- Dongle privacy: App permissions and cloud data sharing vary by app, so review the privacy policy.
- Do not clear early: Record live data and freeze-frame info before clearing codes or completing a drive cycle.
What Is Live Data on an OBD2 Scanner and Why It Matters
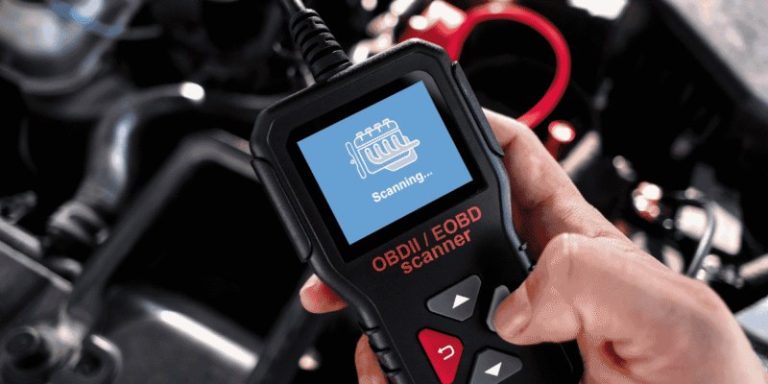
Live data is the stream of real-time sensor readings that a vehicle’s engine control module shares through the OBD2 port. Readings refresh while the engine runs. They show what is happening now, not what happened on a past drive.
Fault codes vs. live data: what you’re actually seeing
A diagnostic trouble code is a stored alert. It says a reading fell outside an expected range. A code points to a system. Live data shows what the sensors are doing right now.
Take P0171, a lean air-fuel mixture code. The code names the problem. Fuel trim, MAF, and oxygen sensor readings explain why. Codes give the symptom. Live data gives the context.
The most useful PIDs for everyday owners: RPM, coolant temp, fuel trims, O2 sensors, MAF, and voltage
PID stands for Parameter Identification, the request a scanner sends to read a specific sensor. Most affordable scanners show standard PIDs. These six matter most for daily drivers:
- Engine RPM: Confirms idle quality and helps you spot surging or uneven idle.
- Coolant temperature: Shows whether the engine reaches normal operating temperature and can reveal a stuck thermostat.
- Fuel trims (STFT and LTFT): Short-term and long-term corrections to the air-fuel mixture. Large or one-sided values point to vacuum leaks or fuel delivery issues.
- Oxygen sensor voltage: O2 sensors cycle between rich and lean. Slow, stuck, or flat readings suggest a failing sensor before a code appears.
- Mass airflow (MAF): Measures air entering the engine in grams per second. Compare it to the expected range for your engine.
- Battery voltage: A quick check of alternator output and charging system health.
How to Find Live Data on an OBD2 Scanner: A Step-by-Step Guide
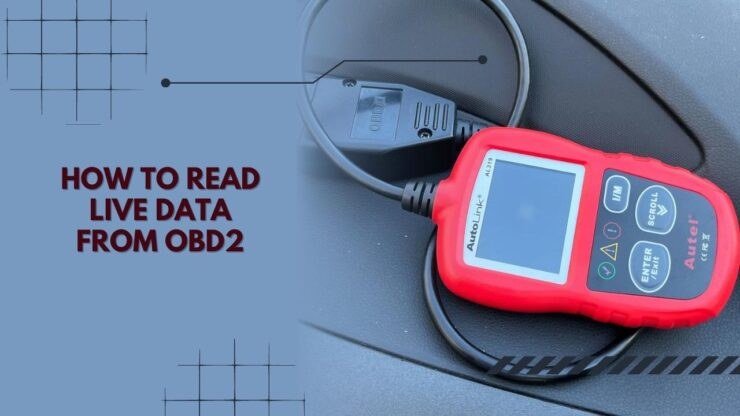
Locate the OBD2 port and confirm model-year and protocol coverage
Most cars built since 1996 have the port under the driver’s side dash, near the hood release. Confirm the scanner covers your year, make, and model. Generic tools may not read manufacturer-specific PIDs.
Check protocol support too. US vehicles use standard OBD2 protocols, but unusual models may need wider coverage.
Set the ignition mode correctly and pair the scanner or app
Most scanners need the ignition ON with the engine off to power up and link. PIDs like RPM and MAF only update with the engine running. Check the vehicle manual for the correct mode.
For Bluetooth dongles, install the app first. Then start the vehicle, plug in the dongle, and pair the phone. If the link drops, restart the app and check the connection.
Open the Live Data menu, select PIDs, and interpret the readings
Choose “Live Data,” “Data Stream,” or “Graph View” from the menu. Select a small set of PIDs. Opening every PID slows the refresh rate and makes the screen hard to read.
At idle, readings should be stable. Watch for jumps, frozen values, or zero readings. One reading rarely proves a failure. Look for patterns across two or three related PIDs.
Live Data Limits: Codes, Emissions Readiness, and Resets
Pending, permanent, and stored codes: what live data will and won’t show
Live data shows only the present. Stored codes stay in memory after a fault. Pending codes appear after one detected failure, before a full test cycle. Permanent codes remain until the ECM confirms the fix.
Clearing codes erases freeze-frame data and useful context. Write down live data readings before you clear anything. Our guide to pending codes explains how these codes behave across drive cycles.
- Record live data and freeze-frame info before clearing codes
- Compare two or three related PIDs before deciding a part is bad
- Confirm the correct ignition mode in the vehicle manual
- Clear codes before you understand what the data shows
- Replace parts based on a single O2 or MAF reading
- Assume a generic scanner will show manufacturer-specific PIDs
Emissions readiness monitors, drive cycles, and reset limitations
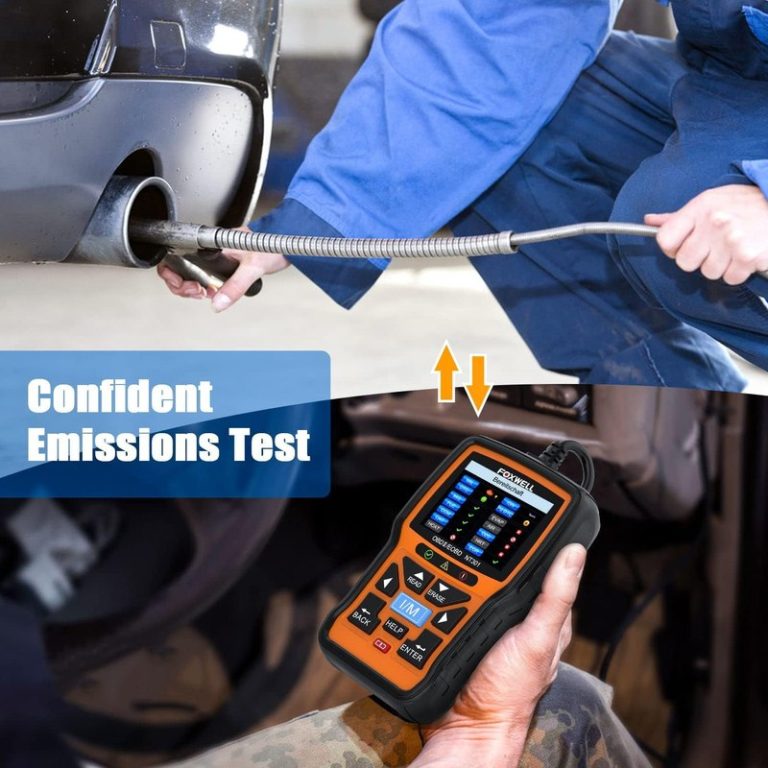
Many emissions programs check readiness monitors, not just codes. “Not Ready” means the ECM has not finished its self-test. This often follows a battery disconnect or a cleared code.
The scanner can show readiness status but cannot finish the test. You must drive the correct drive cycle. Our step-by-step guide to passing emissions after clearing codes covers the sequence.
Choosing the Right Scanner for Live Data: App Dongles vs. Standalone Units
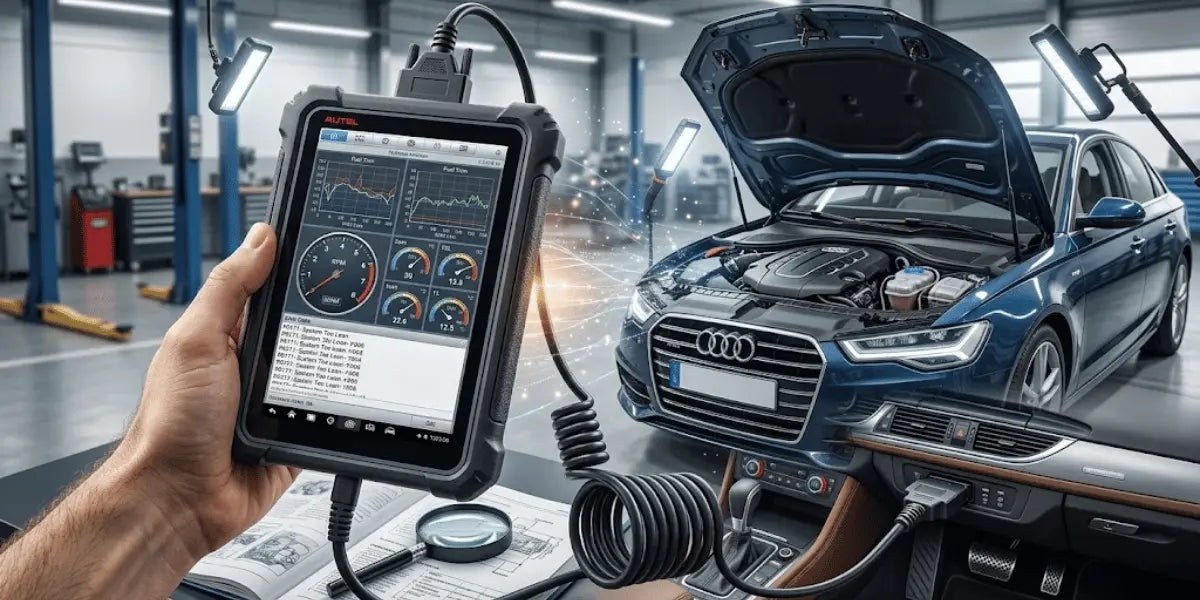
Evaluation criteria: PID coverage, update speed, firmware, and support
Compare four things before buying: PID coverage, refresh rate, firmware updates, and support. Generic PIDs cover the basics. Manufacturer-specific data needs a wider tool. Faster refresh helps catch quick changes in RPM or O2 voltage.
Bluetooth dongles and app permissions: data limits and privacy trade-offs
Bluetooth dongles are small and inexpensive. They rely on a phone app for the display. Refresh speed depends on the dongle and the app, and some vehicle data never appears.
Many apps request location, storage, or account access, and some upload VIN data to the cloud. Check the privacy policy before pairing.
Side-by-side comparison: cost, compatibility, warranty, and ideal driver
| Option | Best for | Owner consideration | Driver consideration |
|---|---|---|---|
| Bluetooth dongle + app | Budget owners who want phone graphs and simple live data | Lower upfront cost, but app updates and phone storage become ongoing factors | Phone screen can distract; set up and read data while parked |
| Standalone scanner | Home mechanics who want a dedicated tool without phone dependency | Higher upfront cost, but firmware updates and warranty support are usually clearer | No phone needed, which lowers distracted-driving risk |
Drawbacks, alternatives, and a transparent verdict
Dongles can suffer from weak Bluetooth and phone dependency. Standalone units cost more and take up space. For bidirectional controls or module programming, a professional scan tool is the right alternative.
Using Live Data to Diagnose Battery and Charging System Problems
System voltage, state of charge, and battery health: what live data really tells you
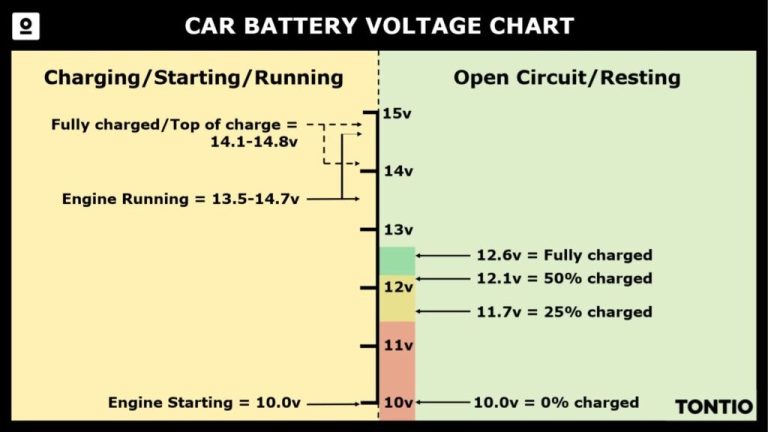
With the engine running, battery voltage usually sits between 13.5 and 14.7 volts. That shows the alternator is charging. With the engine off, the reading is resting voltage. Live data is a snapshot, not a full battery health test. A weak battery can still show normal voltage at idle.
Our article on detecting a bad alternator with an OBD2 scanner explains what live data can and cannot prove.
Battery chemistry, correct connection order, and damaged-battery stop conditions
Live data cannot identify battery chemistry. Flooded, AGM, and lithium batteries need different care. Read the label and the vehicle manual before testing or charging.
If the case is swollen, cracked, leaking, or hot, stop. Do not charge or jump-start a damaged battery. Get professional help.
Hybrid and EV cautions: high-voltage systems and OBD2 safety
Hybrids and EVs use high-voltage traction batteries that are dangerous. A standard scanner reads the 12-volt side, not the high-voltage pack. Never touch orange cables. See a qualified technician for high-voltage warnings.
Live Data for Tire Pressure and TPMS Diagnostics
Door-jamb placard, cold pressure, and gauge accuracy
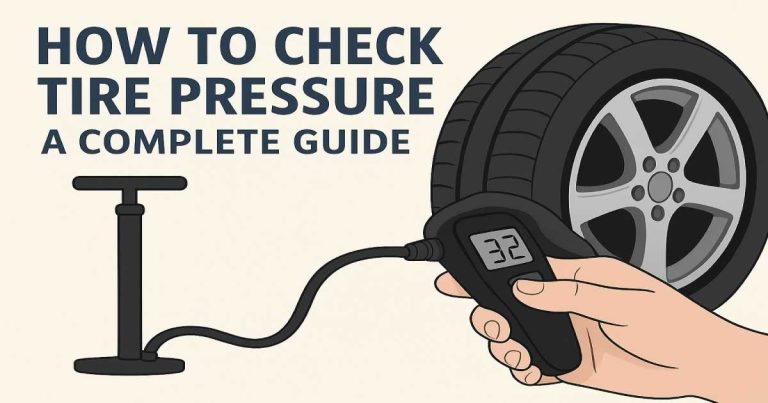
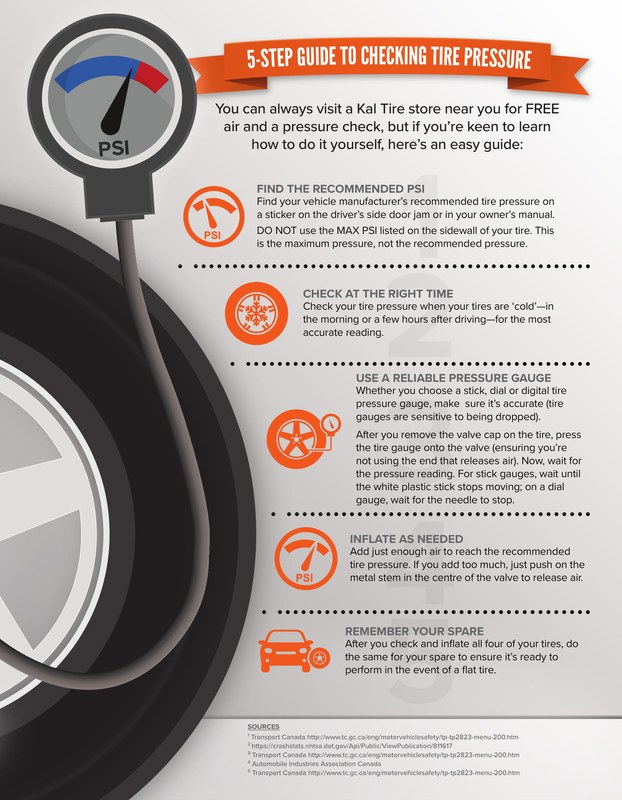
Tire pressure is rarely a standard live data PID. TPMS data usually appears only on vehicle-specific tools. The correct pressure is on the door-jamb placard, not the tire sidewall. Check pressure cold, and remember gauges can drift.
TPMS relearn limits, puncture location, and temporary-repair limits
After a rotation or sensor replacement, many vehicles need a TPMS relearn. Some enhanced scanners can trigger it; many budget tools cannot. If the light stays on, inspect the sensor or the relearn. Our guide to resetting the TPMS light after a tire rotation covers the steps.
Sealants can get you moving, but they can damage TPMS sensors. Use them only as a short-term emergency fix.
When a tire’s condition requires a professional repair
No scanner tells you if a puncture is repairable. Size and location decide that. Sidewall, shoulder, and tread-edge damage usually means replacement. When in doubt, let a tire professional inspect it.
Using Live Data on the Road: Roadside and Emergency Considerations
Safe location, traffic visibility, and roadside scanning
Scanning in a parking lot is safe. Scanning while driving is not. A phone screen can pull your eyes off the road. Have a passenger watch live data, or pull over and stop.
Storage conditions, cable or pack condition, and current limits
Store scanners in a dry place. Heat can damage housings and lithium batteries. Inspect cables for cracks and bent pins. If the tool feels hot or smells, disconnect it. Long sessions can drain a weak battery.
Inflator duty cycle, tool completeness, and post-use inspection
Check the inflator duty cycle before roadside use. Most need rest periods. Work in short bursts and check pressure often. Inspect the hose after use. Our guide on how long a portable tire inflator takes to fill a tire covers realistic fill times.
Privacy, Legal Considerations, and Next Steps
App permissions and data-sharing risks
Diagnostic apps sometimes request unrelated permissions. Location, contacts, and storage access may feed advertising. Read the privacy policy before pairing. When you sell the vehicle, remove your account and stored vehicle data.
Legal variations across US states: emissions, inspection, and tampering
Emissions inspection rules vary by state. Clearing a code does not fix the underlying fault, and tampering with emission parts is illegal under federal law. Check your state agency’s current rules.
When professional diagnosis is the right next step
Live data is a starting point, not a guarantee. If readings confuse you or a safety warning is on, see a professional. Shop-level tools run tests a consumer scanner cannot. Do not replace expensive parts on one reading.
- Best for: DIY owners, commuters, and home mechanics who want real-time sensor readings and a clear record of what the engine is doing before a repair.
- Think twice if: You need bidirectional controls, module programming, or manufacturer-specific diagnostics that only a professional scan tool can run.
- Next step: Confirm your vehicle’s model-year and protocol coverage first, then practice with six basic PIDs at idle before diagnosing a real fault.
Frequently Asked Questions
Live data is a real-time stream of sensor readings from your vehicle’s engine control module. It shows what the engine is doing right now, such as RPM, coolant temperature, fuel trims, and battery voltage, rather than storing past faults.
Many PIDs only update while the engine is running. You usually start with the ignition ON, then start the engine to see readings like RPM, MAF, and O2 sensor activity. The vehicle manual and the scanner instructions will confirm the correct mode.
The scanner may not support the vehicle’s protocol or the specific PID, or the ignition may not be in the correct mode. Restart the vehicle and the app, and check that you selected a standard PID like RPM or coolant temperature.
Basic PIDs are usually the same, but refresh speed and manufacturer-specific data depend on the dongle and app. A standalone scanner may provide faster updates and clearer firmware support, but both tools share the same core live data limits.
Compare several related readings and look for patterns. A single high fuel trim value is a clue, not a verdict. Check for codes, freeze-frame data, and stable behavior at idle and under load before you decide to replace a part.
No. Clearing codes erases the warning and freeze-frame data, but the underlying fault remains. Drive the vehicle, let the monitors run, and check whether the fault returns before you assume the repair is complete.