What Does an O2 Sensor Live Data Reading Mean for Fuel Economy
A live O2 sensor reading tells you in real time whether your engine is running rich, lean, or right on target. Watching voltage, fuel trim, and switching speed helps you protect fuel economy and avoid replacing the wrong part.
If you have ever asked what does an O2 sensor live data reading mean for fuel economy, the direct answer is that it shows whether your engine is burning the right air-fuel mixture in real time. A healthy reading switches quickly between rich and lean. The engine computer uses that signal to control how much fuel the injectors spray, so when the reading looks flat or out of range, mileage is usually the first casualty.
- Voltage is a scale: Around 0.1V means lean, 0.45V is the stoich midpoint, and 0.9V means rich on.
- Fuel trim tells the direction: Sustained positive long-term trim means the computer is adding fuel to fix a lean.
- Warm engines only: O2 sensors work properly in closed loop; live data means little on a cold.
- Clearing codes resets monitors: You can fail a state inspection if readiness monitors show incomplete.
- Check scanner coverage first: Protocol, port access, app permissions, and refresh rate all affect what you can see.
What an O2 Sensor Live Data Reading Means in Plain English
An oxygen sensor sits in the exhaust stream and measures how much oxygen remains after combustion. The engine computer reads that signal and corrects the air-fuel mixture constantly while you drive.
Not every sensor reports the same way. Narrowband sensors, the traditional zirconia type, report voltage. Low voltage means the mixture is lean. High voltage means it is rich. Wideband sensors report an actual air-fuel ratio, like 14.7:1, or a lambda value where 1.0 is the perfect balance.
Sensor labels matter too. Bank 1 is the side of the engine with cylinder 1. Sensor 1 sits before the catalytic converter and shapes fuel delivery. Sensor 2 sits after the converter and checks whether the catalyst is doing its job. When the scanner shows “Bank 1 Sensor 1” live data, you are looking at the sensor that directly controls how rich or lean the engine runs.
How O2 Sensor Readings Directly Impact Fuel Economy and Performance
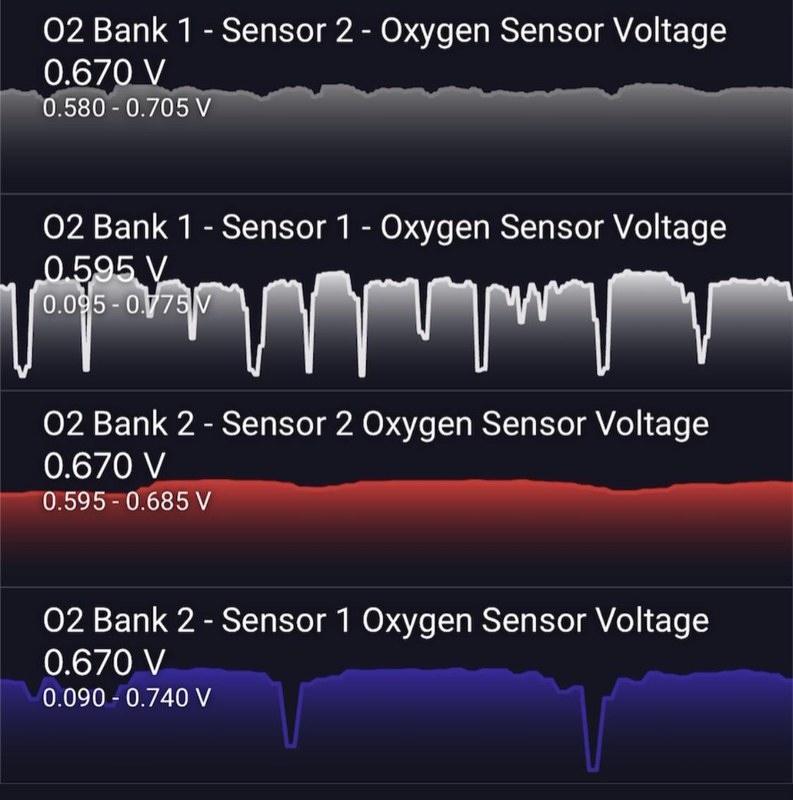
The connection is simple. The engine computer uses O2 feedback to set injector pulse width, meaning how long the fuel injectors stay open. Accurate readings keep the engine near the ideal 14.7:1 ratio at idle and cruise. Wrong readings force the computer to guess, and guessing usually means wasted fuel.
A worn or contaminated sensor often biases the mixture rich, lowering mileage and leaving carbon on spark plugs. A vacuum leak can create a lean reading, and the computer will add fuel to compensate. Both directions hurt fuel economy and can make the engine stumble, surge, or misfire.
Decoding Live Data: Voltage, Fuel Trim, and Switching Frequency
Read O2 data as one story, not a single number. Voltage, switching speed, and fuel trim must agree before you trust the diagnosis.
Voltage Ranges: 0.1V Lean, 0.45V Stoich, 0.9V Rich
For narrowband sensors, treat voltage as a simple scale. Around 0.1V means the exhaust is lean, with excess oxygen left. Around 0.9V means rich, with too little oxygen left. The 0.45V midpoint is stoichiometric, close to the ideal 14.7:1 air-fuel ratio for gasoline.
A healthy sensor at idle and cruise swings quickly across this range. Those fast swings, sometimes called cross counts, show that the feedback loop is active. At wide-open throttle, the reading usually stays rich on purpose.
Wideband sensors change the display. Instead of voltage, the scanner may show a ratio near 14.7:1 at idle, richer under load, and lean on deceleration. Lambda 1.0 means the same thing as 14.7:1, so do not panic when the numbers look different from a voltage readout.
Short-Term vs. Long-Term Fuel Trim: What the Percentages Tell You
Fuel trim shows what the computer is doing about the O2 reading. Short-term fuel trim (STFT) is the fast correction, changing every few seconds based on live O2 voltage. Long-term fuel trim (LTFT) is the learned correction stored over time.
In many service guides, trims inside roughly -10% to +10% are considered normal. If STFT moves around while LTFT stays near zero, the system is healthy. If LTFT sits above +15%, the computer thinks the engine is lean and keeps adding fuel. That pattern often points to a vacuum leak, weak fuel pressure, or a dirty mass airflow sensor, not necessarily a dead O2 sensor.
Not sure where to find these numbers on your tool? How to Find Live Data on an OBD2 Scanner walks through the menus on common scan tools.
OBD2 Scanner Compatibility: Protocols, Port Location, and App Limits
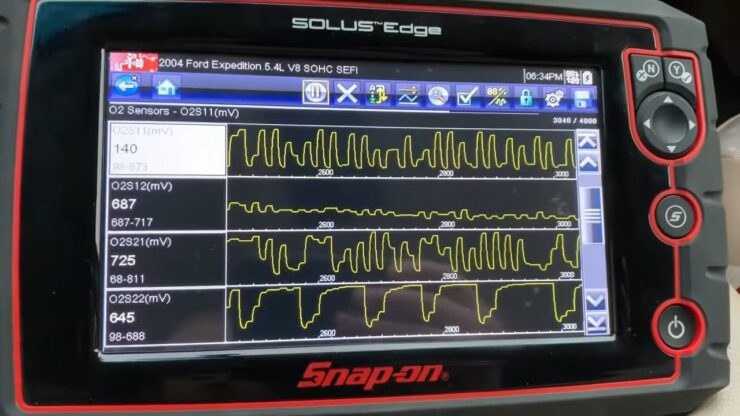
Live O2 data only appears if your scanner can talk to your vehicle. Compatibility has three parts: the vehicle protocol, the port, and the app or firmware behind the display.
Check: Confirm the scanner supports your vehicle’s protocol, including CAN, J1850, ISO 9141, or KWP2000, and that your vehicle is OBD2 compliant, normally 1996 or newer. Limitations: Budget scanners often show generic O2 PIDs only; enhanced manufacturer-specific channels may need a pricier tool.
Model-Year and Protocol Coverage: OBD1 vs. OBD2 vs. CAN
OBD2 became mandatory on 1996 model year US passenger vehicles. Earlier cars use OBD1 with manufacturer-specific connectors and software, so universal scanners usually will not connect at all.
Among OBD2 cars, protocols vary. Many 1996-2007 vehicles use J1850, ISO 9141, or KWP2000. CAN became the common standard around 2008 and communicates much faster. Most new scanners handle CAN, but check the coverage list before assuming an older vehicle will work with your tool.
Port Location, Ignition Mode, and Live-Data Refresh Rates
The OBD2 port sits under the dash, almost always on the driver side near the steering column. It is not under the hood on most cars. Check the owner’s manual if you cannot find it behind the hood release or fuse panel.
The engine must be running and warm for meaningful O2 data. Most sensors only enter closed loop, the mode where O2 feedback controls fuel, after reaching operating temperature. Reading codes often only needs the key on, but live fuel data needs the engine running at idle or steady cruise.
Refresh rate matters too. A scanner that updates once per second can miss the fast switching of a narrowband sensor. Look for a tool with quick updates or a graph view when you plan to watch O2 behavior.
App Permissions and Firmware: What Your Scanner Can and Can’t Show
Bluetooth and Wi-Fi dongles push live data to a phone app, and the app decides what you can see. Some apps lock live data behind subscriptions. Others limit how many PIDs fit on screen at once.
Firmware updates matter as much as app features. Scanner makers release updates that add vehicle coverage and fix bugs. A scanner with no update path may lose support for newer cars over time.
Common O2 Sensor Live Data Patterns and Their Root Causes
Patterns matter more than a single snapshot. These are the two patterns drivers see most often.
Sluggish Switching and Flatline Voltage
A healthy narrowband sensor switches quickly, crossing the 0.45V midpoint many times per minute. When the voltage barely moves, the sensor may be dead, contaminated, or still cold. Damaged wiring or a corroded connector causes the same flat line.
A sluggish sensor that crosses the midpoint only every few seconds often points to aging or contamination. That pattern can trigger O2 sensor circuit codes and a noticeable drop in mileage because the computer cannot correct fuel delivery quickly enough.
Stuck Rich or Stuck Lean: When the Problem Isn’t the Sensor
This is where misdiagnosis happens. A sensor reading rich could be reacting to high fuel pressure, a leaking injector, or a restricted air filter. A sensor reading lean could be reacting to a vacuum leak, a weak fuel pump, or a clogged fuel filter.
The O2 sensor is the messenger, not always the culprit. Compare the voltage with the fuel trims before ordering parts. If both agree on the same condition, the root cause may live in fuel delivery, airflow, or ignition. Replacing the sensor first is a common and costly mistake.
To see whether a scanner can actually point at the failed part, read Can an OBD2 Scanner Tell Which Oxygen Sensor Is Bad.
Emissions Readiness, Reset Limitations, and State Inspection Rules
O2 data is part of the emissions self-test system. The vehicle runs readiness monitors for the oxygen sensor, the heater circuit, and the catalytic converter. These monitors finish only after the vehicle completes a specific drive cycle.
Clearing codes resets those monitors to incomplete. If you reset the system right before a state inspection, many states will refuse the vehicle until the drive cycle completes. Record your live data and freeze-frame data before clearing anything.
If a monitor stays stuck, What Does Readiness Monitor Incomplete Mean explains the causes and your options.
When to Stop DIY Diagnosis and Call a Professional
Live data gets you far, but it has limits. If you see a flatlined sensor, a heater circuit code, or fuel trims stuck at an extreme, the next step may need a wiring diagram, a fuel pressure gauge, or a smoke tester for vacuum leaks.
Call a shop when the wiring looks rusted or damaged, the exhaust is badly corroded, the vehicle is misfiring, or you cannot reach the sensor without lifting the car on a proper hoist.
- Record live data and freeze-frame data before clearing any codes
- Compare O2 voltage with fuel trim before buying a sensor
- Warm the engine fully before judging O2 switching behavior
- Replace an O2 sensor after one code without checking wiring and fuel trims
- Touch a hot exhaust without gloves and eye protection
- Clear codes right before an emissions inspection
O2 Sensor Lifespan, Replacement Costs, and Ownership Tips
Oxygen sensors wear out. Contamination from oil consumption, coolant leaks, or a long-running rich condition shortens their life. Wideband sensors generally cost more and fail differently than narrowband units.
Replacement cost varies by vehicle, sensor position, and whether you choose OEM or aftermarket parts. Some vehicles have four sensors, so confirm the exact bank and position before ordering. Get a current quote from a parts retailer or independent shop for your specific model.
Keep the rest of the engine healthy to protect new sensors. Fix vacuum leaks, address oil consumption, and use the correct sensor type. Follow the manufacturer’s torque and anti-seize guidance during installation, and keep the connector clean and sealed.
- Best for: Drivers who want to understand their engine’s real-time behavior. A live O2 reading answers whether the engine is burning fuel efficiently right now.
- Think twice if: You expect a single reading to name the exact failed part. O2 data identifies the condition; the root cause often still needs vacuum, fuel pressure, and wiring checks.
- Next step: Use a compatible OBD2 scanner, warm up the engine, and record both O2 voltage and fuel trim before replacing anything.
Frequently Asked Questions
0.45V is the stoichiometric midpoint for a narrowband O2 sensor, but a healthy sensor swings across the range. A voltage frozen at 0.45V means the sensor is not switching, which usually points to contamination, wiring damage, or a dead sensor.
Most 1996 and newer US vehicles support generic OBD2 live data, so many entry-level scanners can display O2 voltage. Some vehicles only transmit certain oxygen sensor PIDs through enhanced manufacturer channels, so check coverage before buying.
The engine may not have reached operating temperature, or the vehicle may use a protocol the scanner does not support. A blown fuse, damaged wiring, or a failed sensor can also cause the PID to read zero or blank.
No. Clearing codes only erases stored diagnostic information and resets readiness monitors. If the underlying mechanical cause remains, the check engine light returns and fuel economy keeps suffering.
Cost varies by vehicle, sensor position, and whether you choose OEM or aftermarket parts. Verify current pricing for your exact make and model at a parts retailer or shop before ordering.
Some replacements are DIY-friendly if the sensor is easy to reach and the threads are not rusted. If the sensor is seized, the exhaust is hot, or you lack the right tools, a professional shop is safer.